Agriculture
Application: Agriculture
What is the temperature underground where your crops grow? We measured the top 30 cm of ground temperatures in mid July day and night so that you could see the interesting characteristics and timing.
The surface temperature was by far the hottest and coldest, and the temperatures farther underground were much more stable. Notice the increasing phase shift with depth: the 30cm-deep waveform is almost 180 degrees (pi radians) out of phase with the surface waveform. The surface reached its highest temperature around 4:00 in the afternoon, while the temperature 30 cm down peaked at 2:30 in the morning, long after the sun had gone down.
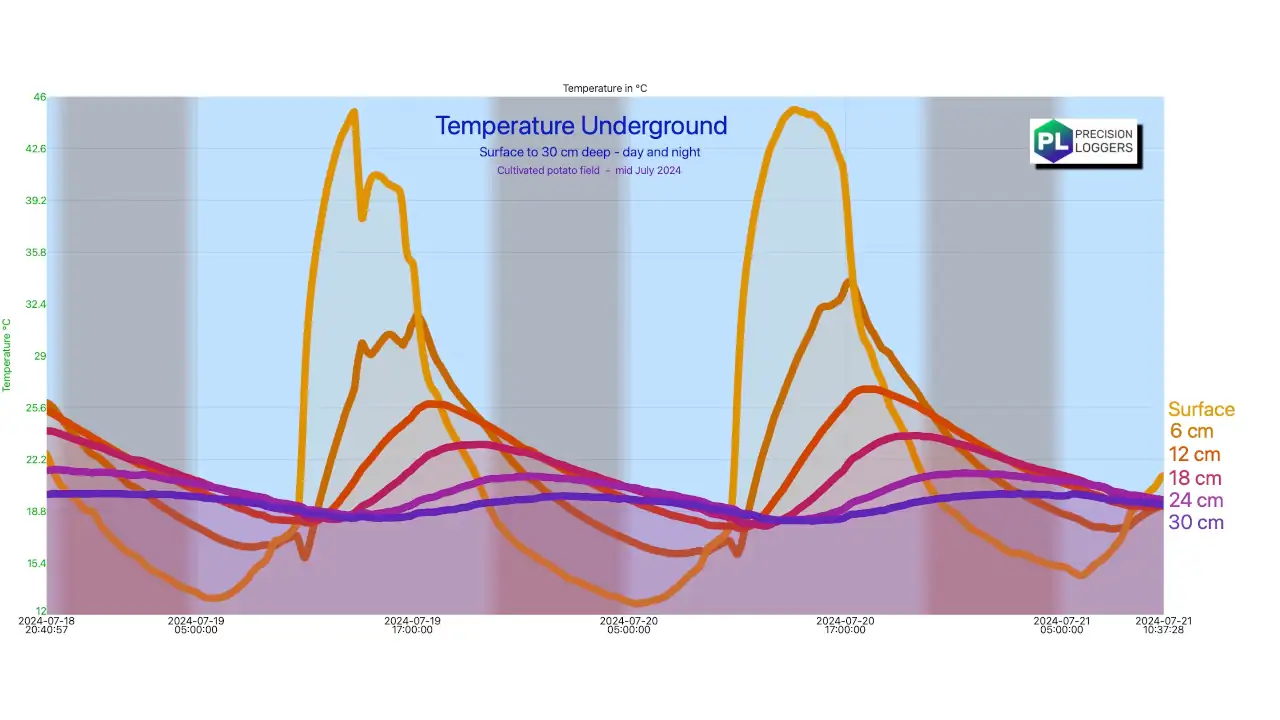
For this graph we used five Precision thermocouple loggers with K thermocouples, and the graph was made using Precision Loggers Software running on an iMac M1 computer.